What is it and why would you need it ?
Modal analysis (point counting) data provides fundamental information on the composition of your samples, including:
- Original detrital mineralogy.
- Authigenic mineralogy.
- Nature and abundances of macropores.
Data / results are presented in spreadsheet format, integrated onto individual sample descriptions and used extensively throughout our reports on various plots and diagrams. The phases differentiated during modal analysis are tailored on a project-by-project basis – and can be designed to be consistent with existing datasets for mature fields, or compliant with the inputs required for “Touchstone” modelling.
Modal analysis data can be used for a variety of purposes. We spend a lot of time interrogating these data alongside other information (textural data, detailed sample descriptions, routine core analysis, sedimentology, logs) to provide an understanding of the controls on reservoir quality and how this may vary vertically and laterally within your field / prospect. The data can also be used:
- To understand vertical and lateral variability in detrital and authigenic mineralogy.
- To understand the extent and nature of diagenetic overprinting – cementation and dissolution effects.
- For compaction analysis.
- In provenance studies.
- For calibration of wireline logs.
 How do we collect the data?
Considerable care is taken when defining the strategy for categorisation of the grain types, mineral species and pores present within a sample set. We can also collect data suitable for use in Touchstone models.
The chosen strategy will vary depending on the nature of the samples and the aims of the study. For example, we may try to collect information on the original nature of grains that have been replaced by diagenetic phases to enable reconstruction of detrital mineralogies. Alternatively we may tailor the analysis so that it is easier to extract bulk mineralogy data.
The strategy / point count “categories” adopted will almost invariably include, amongst other considerations:
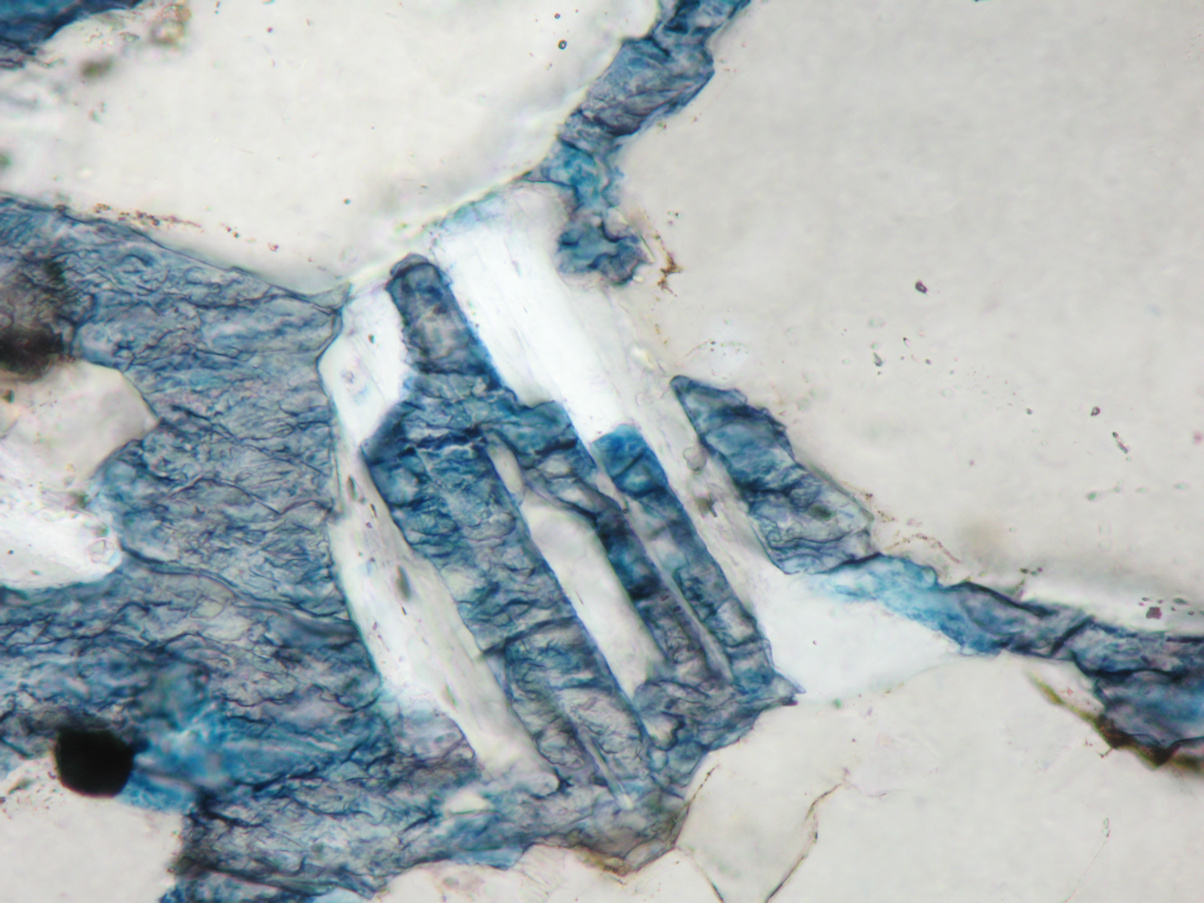
- Some differentiation of grains within the lithic grain assemblage (e.g. by origin, by definable rock-type, by mineralogy or by degree of alteration).
- Differentiation of detrital from authigenic clay.
- Categorisation of detrital clay(s) of different habits and/or compositions.
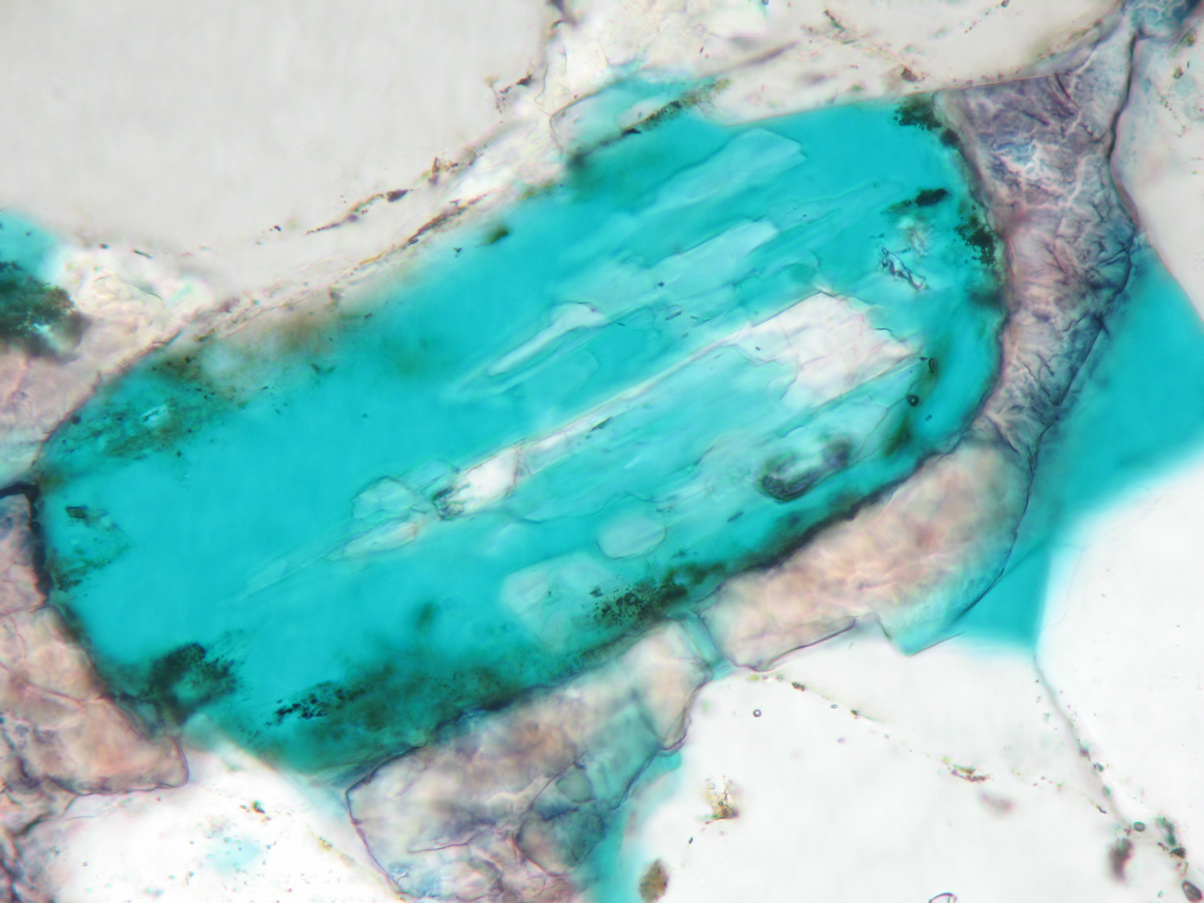
- Differentiation of authigenic material that replaces grains, that which fills originally primary pores, and that which occurs in fractures.
- Categorisation of different authigenic clay types – which may be based on mineralogy (where this is apparent) and/or habit and/or distribution (e.g. pore-lining versus pore-filling).
- Subdivision of authigenic components based on habit (e.g. microcrystalline K-feldspar would be recorded separately to K-feldspar overgrowths).
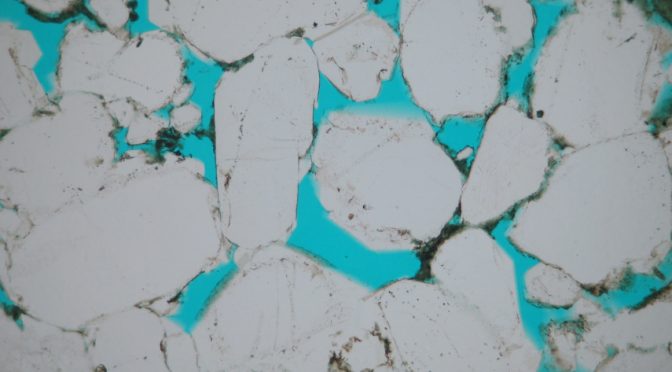
- Differentiation of different pore types – primary pores versus secondary pores, connected pores versus isolated pores.
Advantages of modal analysis relative to other methods (e.g. XRD, QEMSCAN)
- Enables differentiation of detrital from authigenic material of the same mineralogy (e.g. detrital quartz versus authigenic quartz – which is not possible using any automated petrography technology, or bulk mineralogical analysis available at the moment).
- Enables recognition and differentiation of lithic grain material (e.g. mono-mineralic feldspar grain versus feldspar crystals within a granite rock fragment).
- Differentiates primary and secondary pores.
- Differentiates between authigenic material in primary pores and that which replaces grains.
- Does not require (particularly) expensive equipment to collect data (relatively cheap to collect data).
Disadvantages of modal analysis relative to other methods (e.g. X-ray Diffraction, Automated Mineralogy)
- Subject to a degree of operator bias.
- Relatively wide analytical error bars at low abundances of specific components.
- Identification of the mineralogy of very fine components (especially clays) can be difficult. We will generally back-up thin-section observations / interpretations of clay mineralogies using more detailed scanning electron microscope analyses and X-ray diffraction).
- (Relatively) labour intensive.