
![]()
We offer a wide range of petrography analyses and description styles, including (but not limited to) observation and measurement using the following:
- Optical (plane polarised light) Microscopy
- Scanning Electron Microscopy
- Cathodoluminescence Microscopy
- Epifluorescence Microscopy
Available Petrography Services
Our petrographic and microscopic analytical and descriptive services, include:
- Textural Analysis
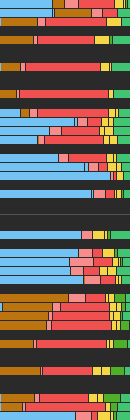
- Modal Analysis
- Grain (Pore) Coating Analysis
- Petrography Descriptions (Optical and Scannning Electron Microscopy)
- Cathodoluminescence (Optical and SEM-based)
- Epifluorescence
- Compaction Analysis
- Pore Image Analysis
All these analyses and observations are used in our reservoir geology projects to build understandings of depositional / sedimentary characteristics, diagenetic overprints,and ultimately pore systems and reservoir quality. These analyses also have other applications related to mineral deposit studies, engineering geology / geotechnical studies and palaeohydrogeological studies.
Textural Analysis
Why? Textural Analysis provides basic data on sandstone grain size, which almost invariably exerts some degree of control on final reservoir quality (either directly, or indirectly depending upon the degree of diagenetic overprinting). Grain size data is also useful for calibration of core grain size in heavily cemented or fractured sediments, where original grain size may not be apparent in core, and cannot be measured accurately using bulk appraoches (e.g. seive analysis or laser particle sizing).
Read a more detailed page about Textural Analysis. back to top
Modal Analysis
Why? Modal analysis (point count) data provides fundamental information on the composition of your samples, including:
- Original detrital mineralogy.
- Authigenic mineralogy.
- Nature and abundances of macropores.
Data / results are presented in spreadsheet format, integrated onto individual sample descriptions and used extensively throughout our reports on various plots and diagrams.
Read a more detailed page about Modal Analysis. back to top
Grain Coating Analysis
Why? Grain coatings (most-notably detrital and authigenic clays, but also other minerals such as microquartz and microcrystalline carbonates) may have a significant effect as inhibitors for development of quartz cements during burial diagenesis. Coatings disrupt nucleation of overgrowths on detrital grain surfaces. The extent of the disruption is a function of the continuity, density and character of the coatings. We can characterise grain coating materials descriptively, semi-quantitatively or quantitatively.
Petrography Descriptions
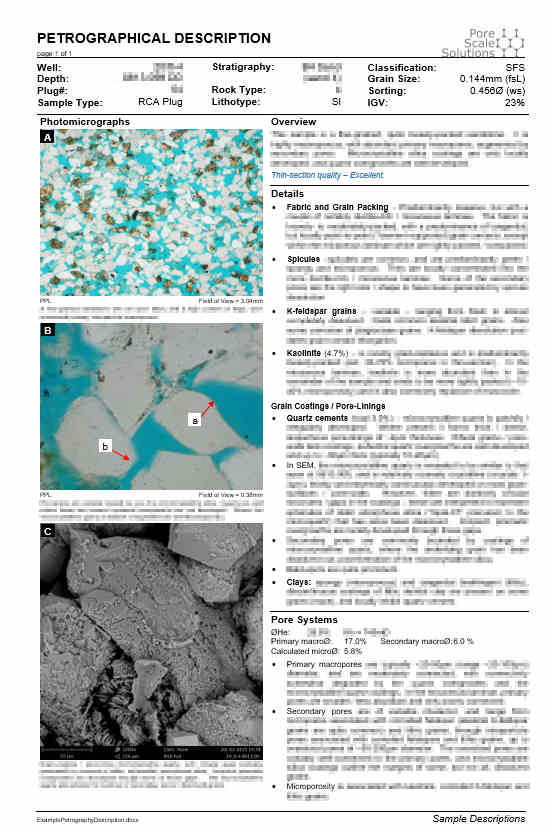
We offer sample descriptions at a range of level of detail, from summary petrogaphy descriptions focussed on a specific feature set, up to complete-comprehensive petrographic characterisation of all aspects of the sample. Levels of documentation are tailored to reflect the specific study requirements.
Most of the descriptive work is carried out using optical (plane-polarised light) light microscopy. However, additional detail will usually be added using scanning electron microscopy and other microscopy / petrography methods as required. Any addtional microscopy observations are incorporated directly into the sample descriptions (and not presented as separate descriptions).
Read a more detailed page about Petrographic Descriptions. back to top
Cathodoluminesence
Why? Optical and SEM-based cathodoluminesence imaging is used in petrography (in our work, mostly related to quartz and carbonate cements) to resolve additional detail about mineral paragenesis. Cathodoluminesence can reveal details of internal zonation that are not evident using other imaging techniques, and enables finer-scale differentiation of multiple generations of a specific mineral phase. Cathodoluminesence is also used in compaction analysis to differentiate between detrital and quartz overgrowths in sandstones that lack well-defined “dust-rims” between the grains and their overgrowths.
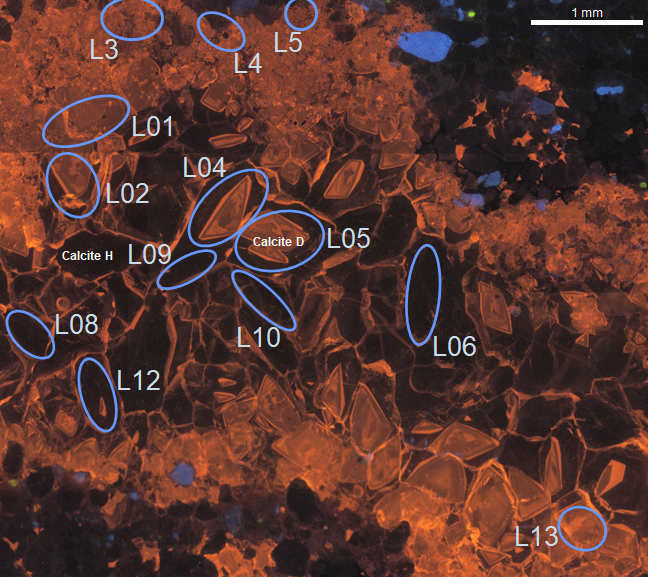
Epifluorescence
Why? We primarily use epifluorescence to investigate the character and distribution of hydrocarbons trapped within fluid inclusions.
Read a more detailed page about Epifluorescence. back to top
Compaction Analysis
Features of the samples such as degree of grain contact elongation provide qualitative information on packing fabrics. For a more quantitative approach, we collect our modal analysis data in such as way that it can be used to calculate intergranular volumes and more sophisticated measures of compation such as “compactional porosity losses” (which, amongst other things, corrects intrgranular volumes for differences in primary porosity).
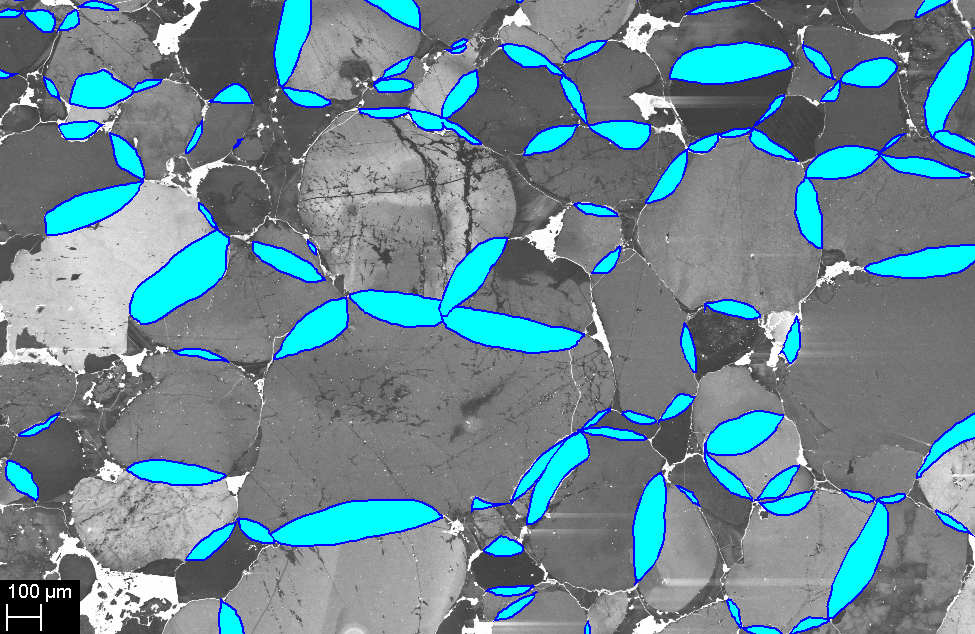
Pore Image Analysis
Why? It is not always possible too collect pore (throat) size distribution data using the well-established mercury intrustion porosimetry (“MICP”) method. As an alternative, we can collect pore size distribution data using image analysis of scanning electron microscope (SEM) images. This methodology is applicable to any lithology (and is well-suited to very fine-grained sediments such as micritic limesonte / chalk). Data can also be collected from fragments of a specific lithology within cuttings samples, extending the “reach” of capillery-pressure type measurements into uncored intervals.
SEM images are collected systematically over an area of a polished thin-section. Images are segmented into pores and “grains” (everything else), touching pores are separated and detailed information on pore volumes and pore sizes is collected.
These results can be used alongside other measures of pore volume and pore size when modelling permeabilities (e.g. helium porosities, mercury intrusion data, and nuclear magnetic resonance data).
Read a more detailed page about Pore Image Analysis. back to top