 Scanning Electron Microscopy (SEM) can be carried out as a stand-alone service, or in support of other petrographical analyses / descriptions. We can analyse a range of sample types including small rock chips (“stub” samples) and polished thin-sections, as well as other materials.
Our main uses for SEM imaging and analysis are:
- Detailed characterisation of clay mineralogy and other microcrystalline components (and their associated microporosity)
- Elucidation of paragenetic relationships
- Investigation of zoning and chemical variability within cements.
- Systematic / automated collection of images for pore image analysis
- Preparation of petrographical montages for deep zoom imaging
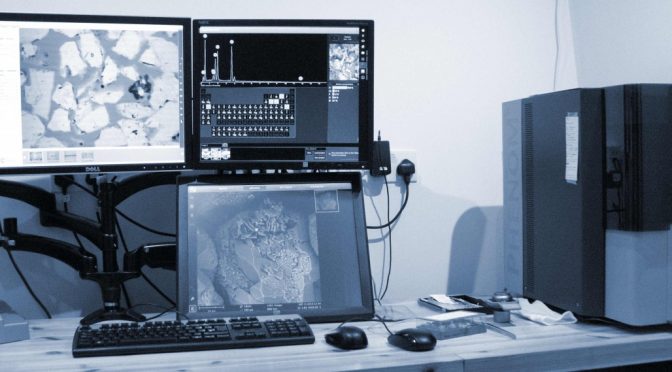
Because we have Scanning Electron Microscope capabilities in-house, we can offer a rapid turnaround / hotshot analysis of samples. (Many geological materials can be analysed with a minimum of preparation – the samples only need to be dry and, in the case of samples containing liquid hydrocarbons, light cleaning is also required ).
Detailed characterisation of clay mineralogy and other microcrystalline components (and their associated microporosity)
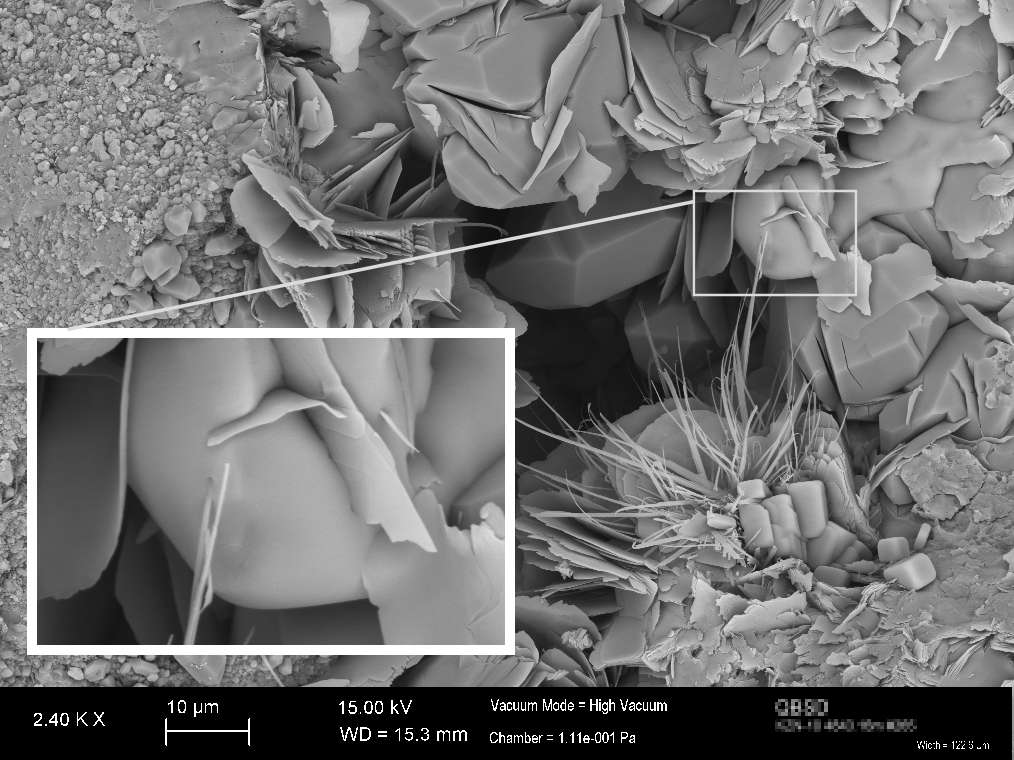
SEM analysis can reveal the detailed morphology and inter-relationships of clay minerals which may not be clearly resolved in thin-section / optical microscopy.
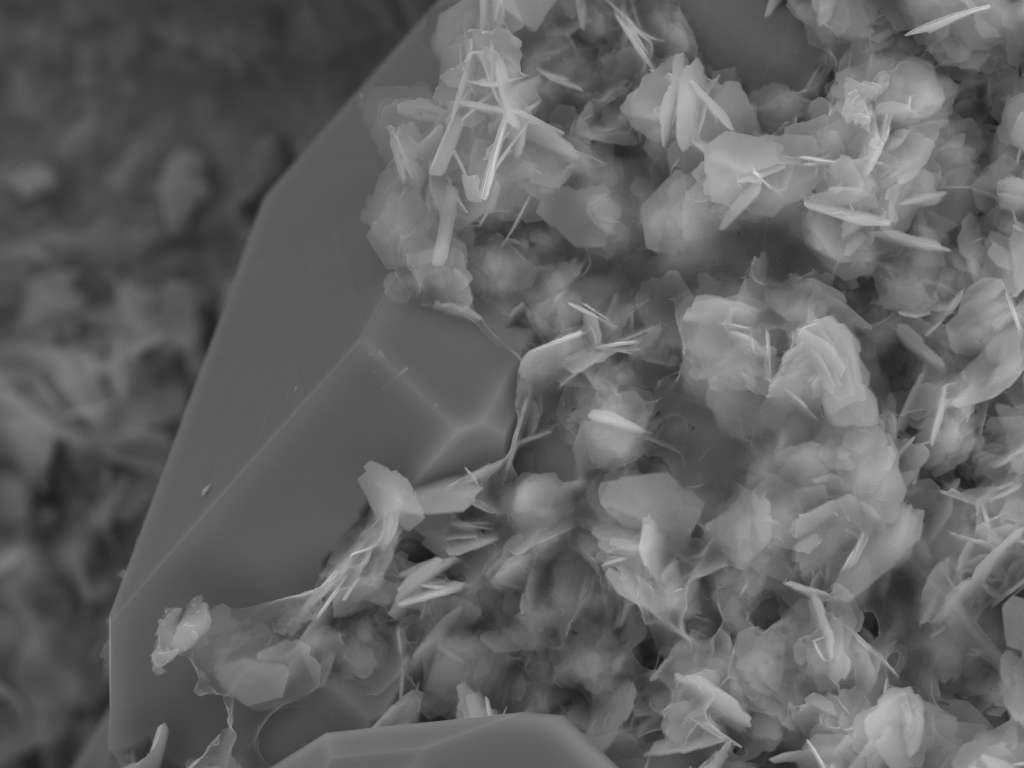
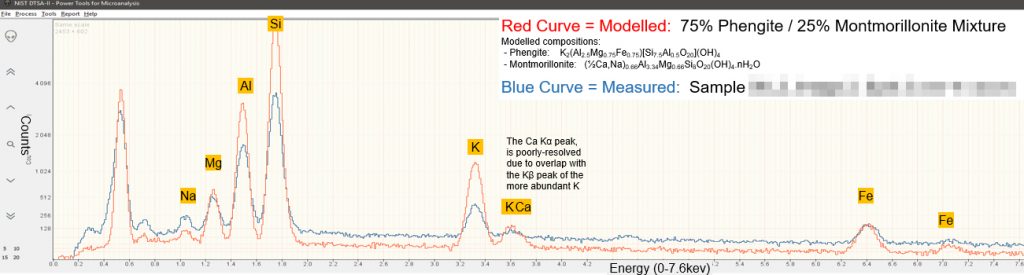
Chemical (energy dispersive X-ray) analysis, coupled with the morphological information also provides additional information that can help ascertain the mineralogy of the clay. We like to use DTSA-II to process and compare measured X-ray spectra against synthetic and standard spectra, offline.
Elucidation of paragenetic relationships
SEM analysis often reveals details of finer-scale intergrowth relationships between different minerals that are either unclear or non-resolvable using optical microscopy.
Investigation of zoning and chemical variability within cements.
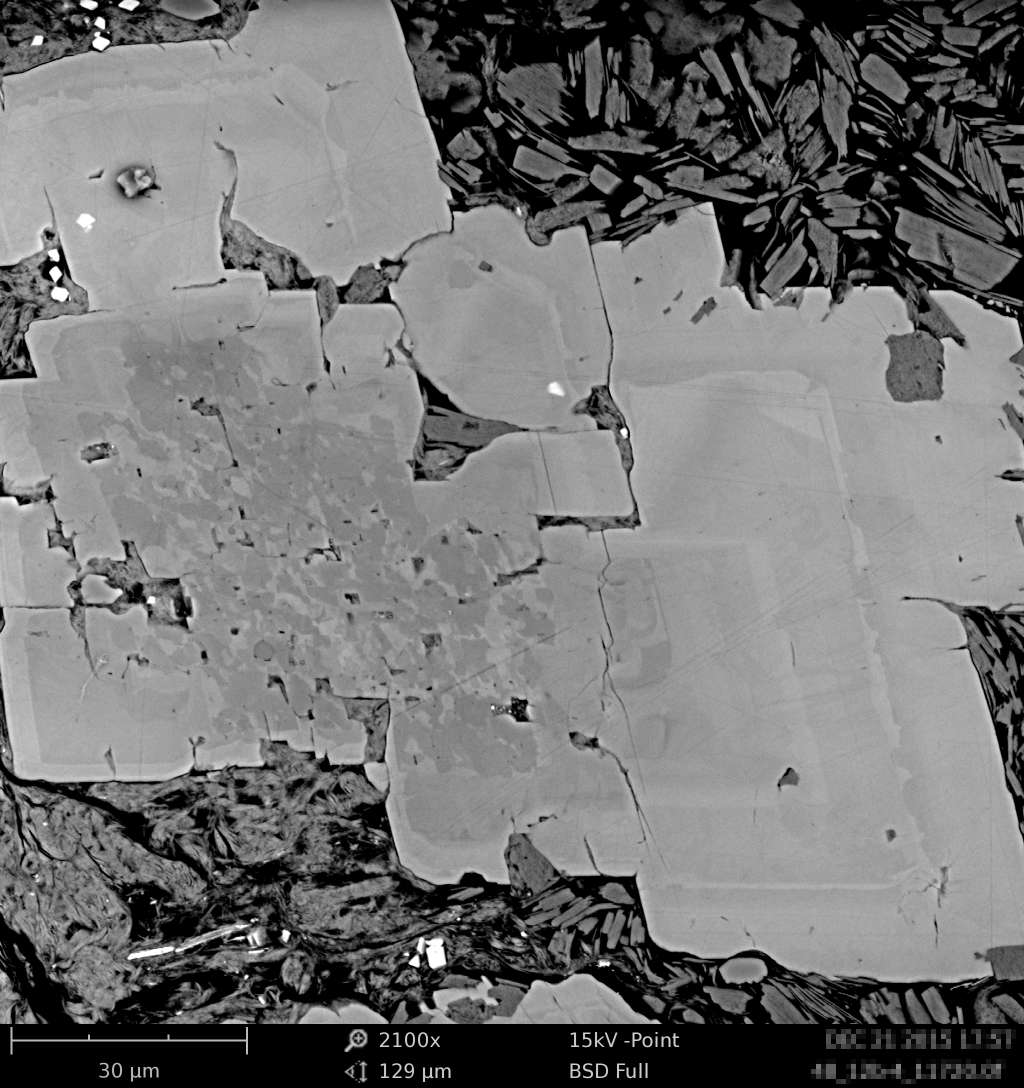
Back-scattered electron SEM imaging may also reveal compositional zoning that is not evident in thin-section. Energy dispersive x-ray analysis coupled with the variations in “Z-contrast” evident in the SEM images provide information on variations in mineral chemistry that may be used to subdivide and correlate cementation episodes between samples, and provide information on diagenetic conditions (e.g. redox).
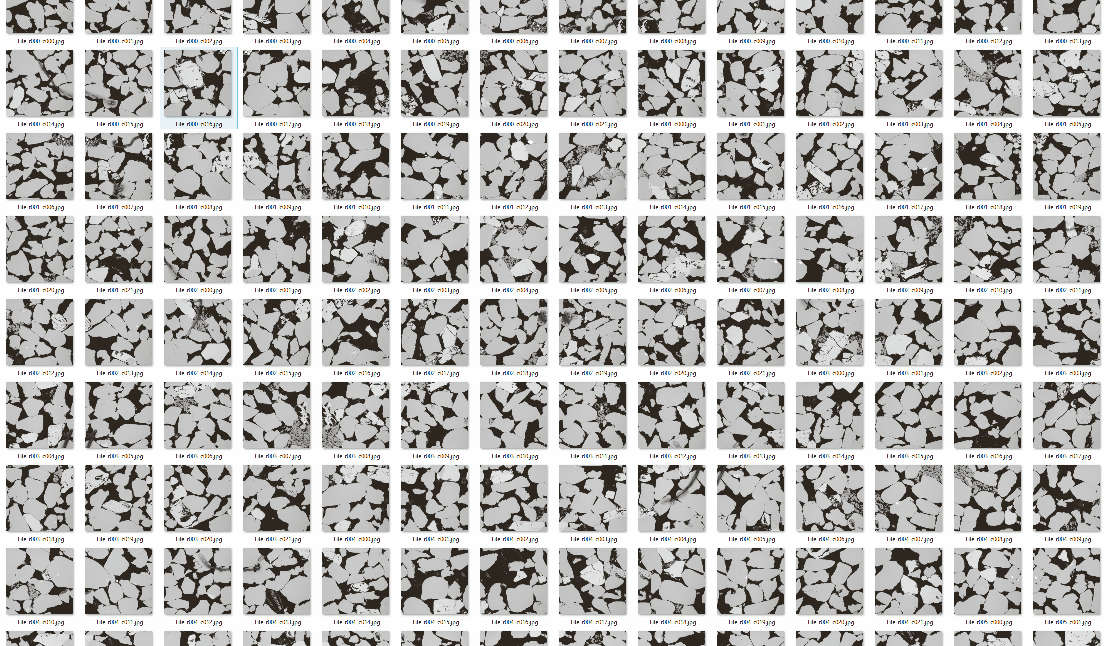
Systematic / automated collection of images for pore image analysis, and preparation of petrographical montages for deep zoom imaging
Images can be collected during unattended operation and subsequently processed for pore image analysis and / or stitched to generate deep zoom photomontages. Typical runs collect anywhere between 100-400 individual images.