
What is it and why might you need it ?
Textural Analysis provides basic data on sandstone grain size, which almost invariably exerts some degree of control on final reservoir quality (either directly, or indirectly depending upon the degree of diagenetic overprinting). The grain size data is also useful for calibration of core grain size in heavily cemented sediments, where original grain size is not always easy to determine in core, and cannot be measured accurately using bulk approaches (e.g. seive analysis or laser particle sizing).
We provide the raw data, as well as summary statistics including averages, sorting and other measures of spread and skew – including systematic grain size classification (in ½Φ bins).
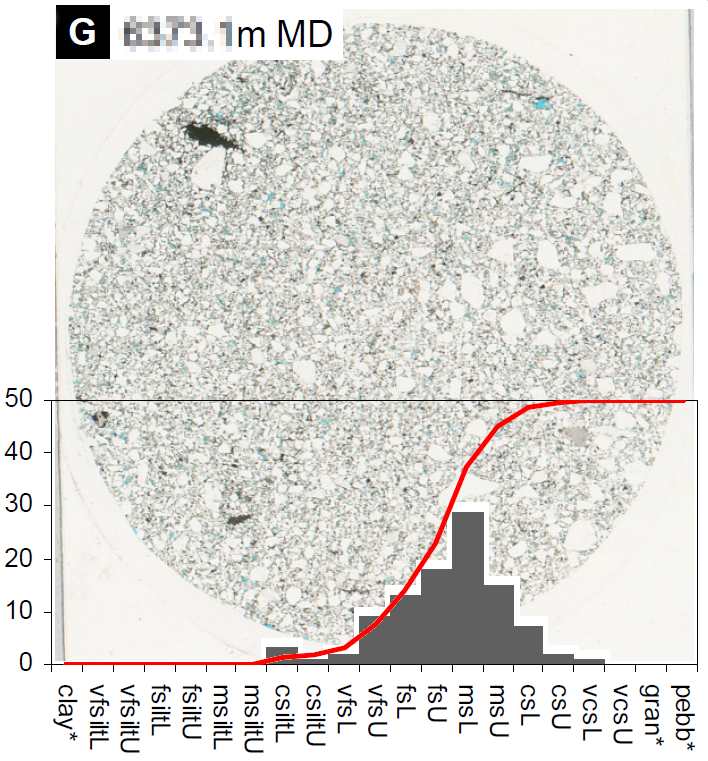 Example grain size frequency distribution for a single sample.
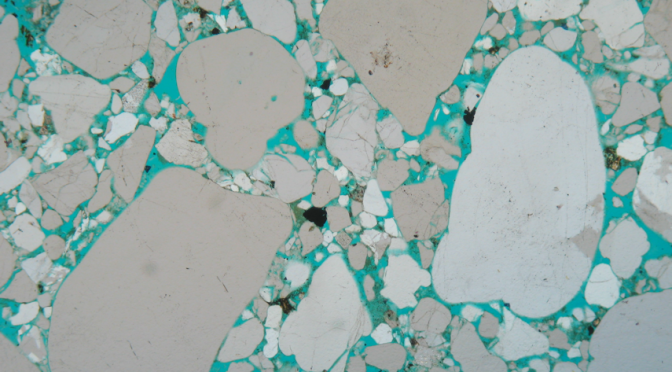
How do we collect the data? The analysis is usually carried out using representative photomicrographs of samples. However, where grain / overgrowth boundaries are not well defined in images, we can also measure samples directly on the microscope. Where samples include particularly coarse grains (pebbles etc.) measurements may also collected from images of samples captured using a flat-bed scanner. Long grain axes of 100 rigid grains with similar hydrodynamic properties are measured.

Comparison of grain size cumulative frequency distributions for a suite of (diverse) samples.
Advantages of thin-section textural analysis relative to other bulk methods (e.g. sieve, LPSA)
- Enables collection of data from hydrodynamically similar minerals (e.g. quartz and feldspar). Amongst other things, we do not include measurements of heavy mineral grains (due to their high density) or flakes of mica (due to their platy habit).
- Enables collection of original (depositional) grain size – which may not be possible using bulk analyses. Overgrowths are not included in the grain diameter measurement. Where grains have inter-penetrant contacts, visual-estimation is used to reconstruct the original grain size/shape. Where grains are brecciated, we have to resort to visual estimation to reconstruct orignal grain shapes and sizes.
- Only captures data from the granular material in the sample, ignoring the fine size fractions (i.e. clay).
- Is unaffected by inter-granular cements that would be disaggregated and included in a bulk sample, and so can be applied to heavily-cemented lithologies.
Disadvantages of thin-section textural analysis relative to other bulk methods (e.g. sieve, LPSA)
- Subject to a degree of operator bias. This is minimised internally through application of a consistent methodology and cross-checks between different staff, and also by validation against other data types in comparative studies of poorly-consolidated, uncemented sands.
- Is carried out on a relatively limited number of grains (typically “only” 100 measurements per sample), with association assumptions regarding the representivity of the analysed grains.
- Data provided in terms of grain counts, rather than the weight% of the different size fractions, so will tend to understate the importance of coarser grains (a single coarse grain is volumetrically more significant than a single fine grain).