Tag Archives: Scanning Electron Microscopy

SEM Pore Image Analysis

Icon Illustrating A Sandstone Pore System

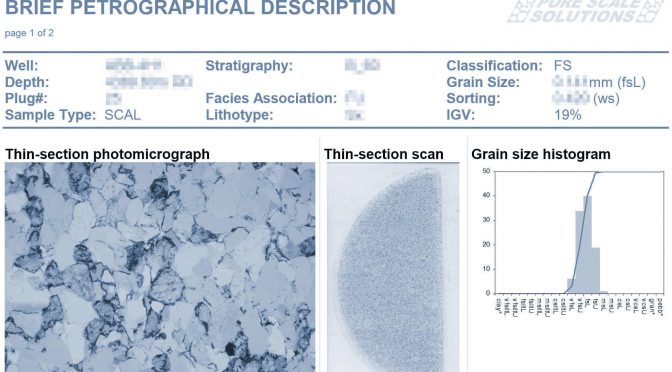
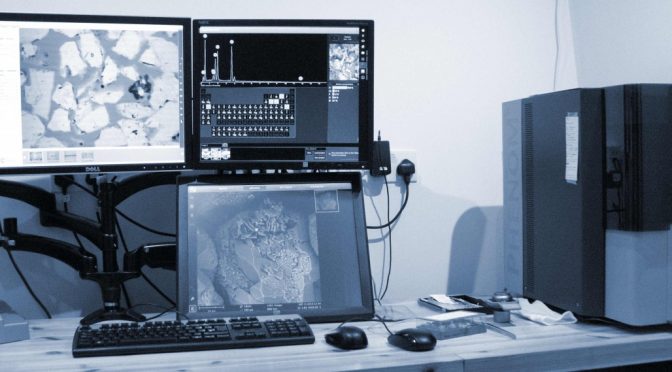
Traditionally pore throat size distribution data is measured using mercury intrusion porosimetry (or MICP).  However, this is not always possible /appropriate, so we can also offer pore size distribution data generated from analysis of scanning electron microscope (SEM) images.  This methodology is applicable to any lithology (and is well-suited to very fine-grained sediments such as micritic limesonte / chalk).  Data can also be collected from fragments of a specific lithology within cuttings samples, extending the “reach” of capillery-pressure type measurements into uncored intervals.

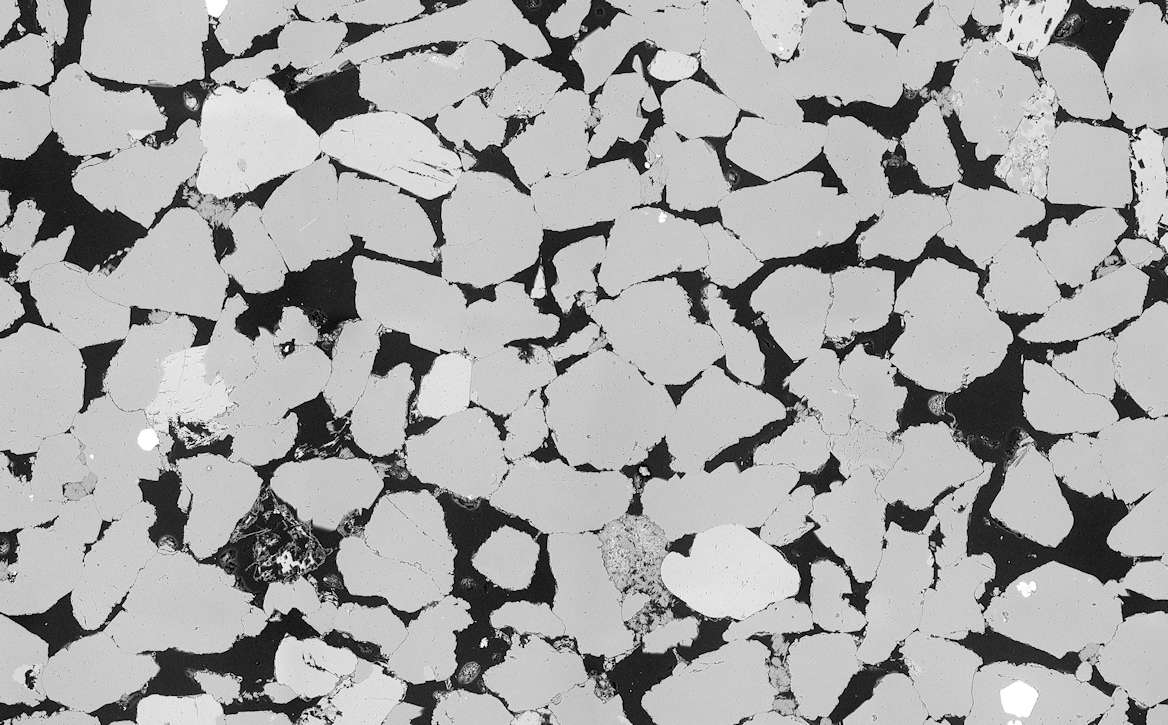
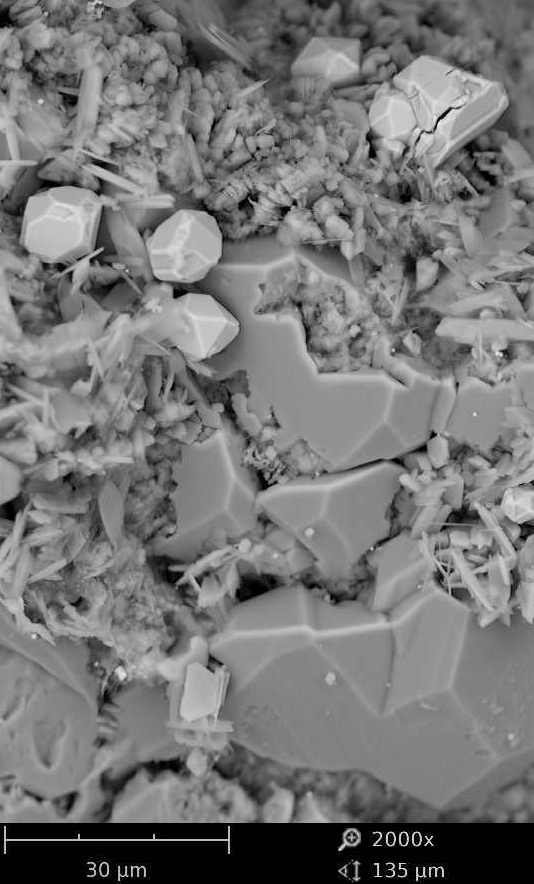
SEM images are collected systematically over an area of, or of random fields within, a polished thin-section.  Following segmentation of the images into pores and “grains” (everything else), detailed information on pore volumes and pore sizes is collected.

These results can be used alongside other measures of pore volume and pore size when modelling permeabilities (e.g. helium porosities, mercury intrusion data, and nuclear magnetic resonance data).

Imaging

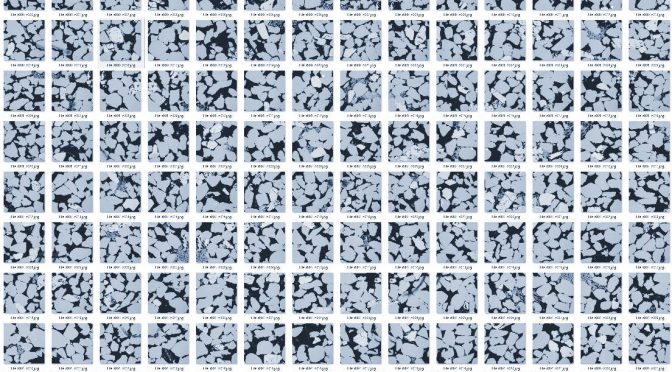
The strategy for image collection is dependant upon the nature of the sample and its pore system.  The SEM magnification is set according to the range in pore size we are attempting to characterise.  Depending upon the samples, we may collect images from random, non-contiguous fields over the sample area, or regularly distributed, overlapping fields (that can also be stitched into deep zoom photomontages).

Backscatttered SEM image showing a porous sandstone.
Extract from a larger photomontage stitched from 240 individual images. Grains / mineral matter appear in various shades of grey.  Pores appear black / very dark grey. (Field of view of this extract ~1875um; the source montage is~19000*12000 pixels and covers a real world area of ~10.0*6.0mm, with a resolution of 1pixel ~0.5*0.5um).

Segmentation

Thresholded image showing pores (black) and grains (white).
Extract from a larger photomontage stitched from 240 individual images. Grains / mineral matter appears in various grey shades. Pores appear black / very dark grey. (Field of view of this extract ~1875um; the source montage is~19000*12000 pixels and covers a real world area of ~10.0*6.0mm, with a resolution of 1pixel ~0.5*0.5um).

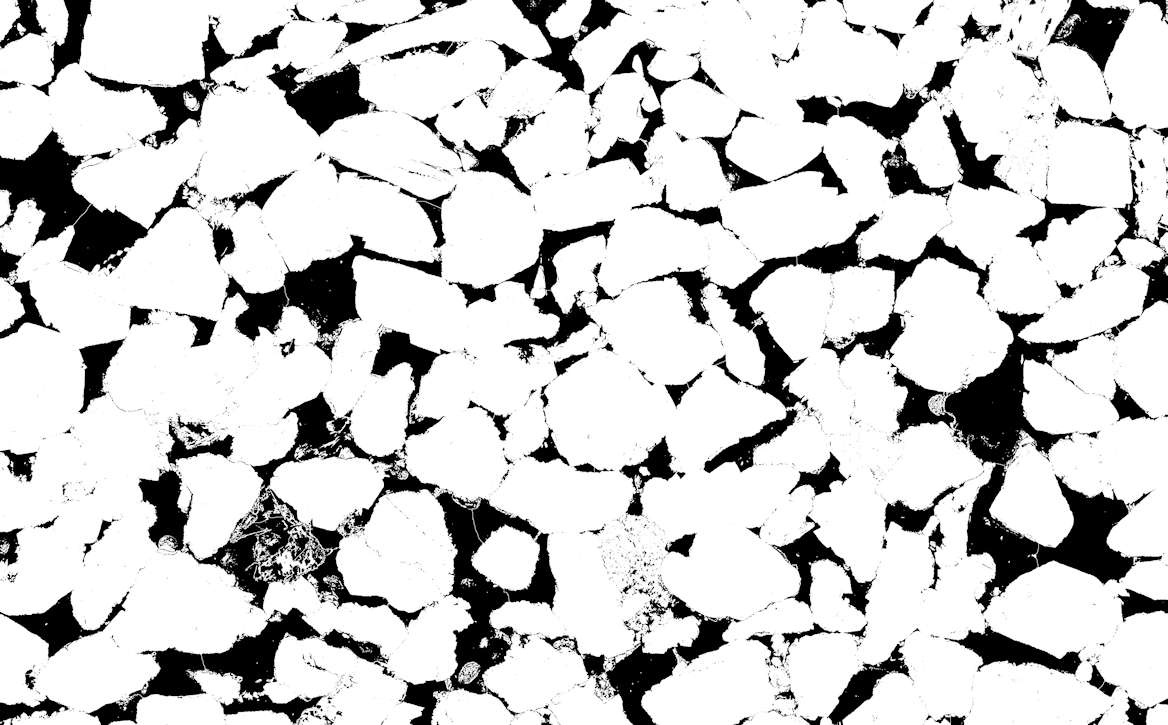
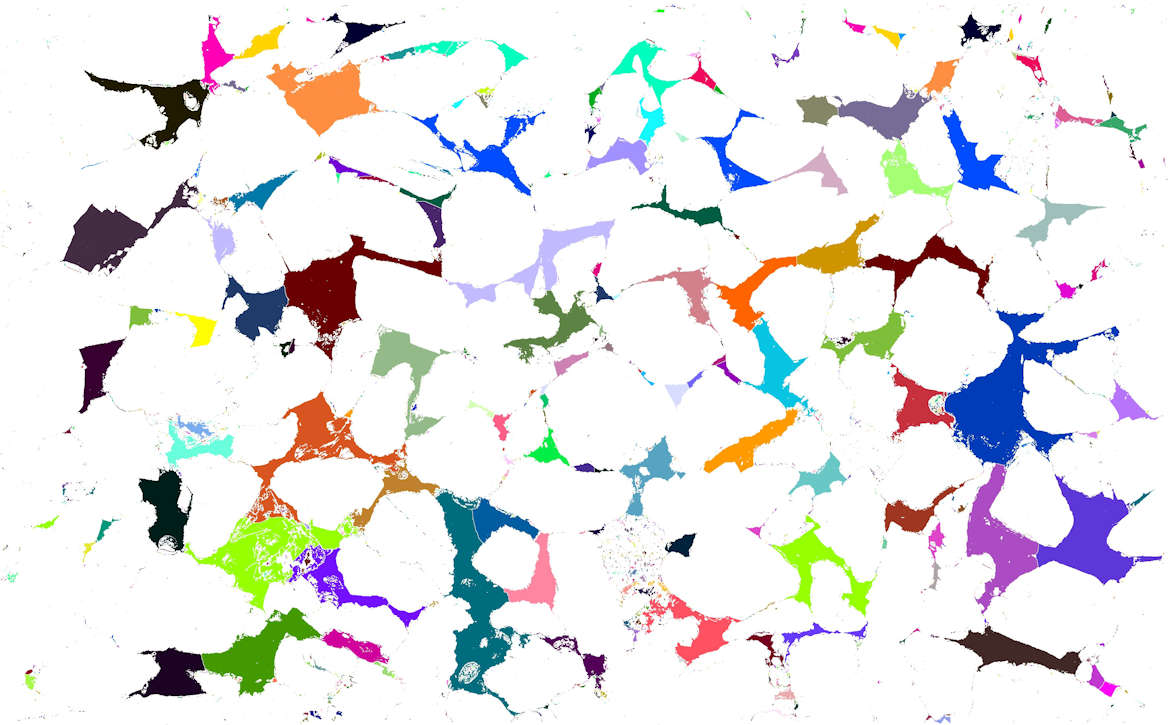
Image analysis routines are used to normalise images to consistent grey-scales and to remove any shading effects.   Pores are then segmented from grains and, where required, more advanced routines are used to separate / subdivide touching / connected macropores from one another.

Measurement

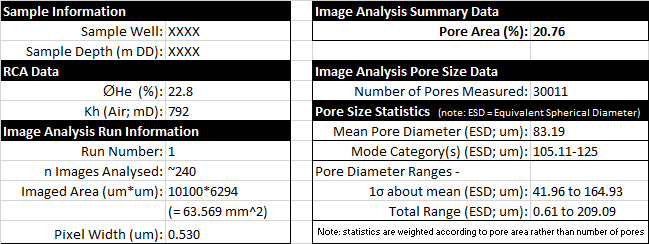
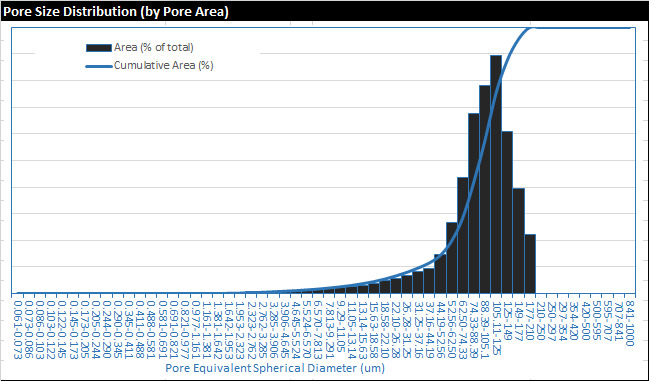
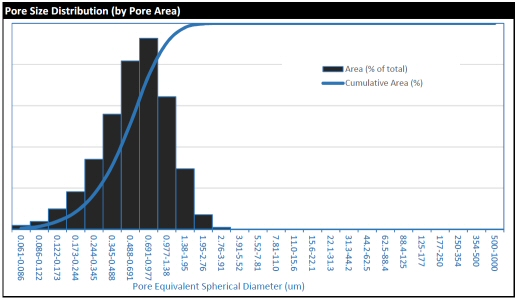
Pore sizes and areas are measured and the results processed to provide total pore areas and pore size distribution data.

Image analysis output showing segmented and separated pores.
Same field of view as shown above showing measured pores [separate pores shown in different colours] and grains [white]. (Field of view of this extract ~1875um.)

Output Data

Results provided include:

  • Summary data (pdf format; including summary and plot shown as below),
  • Detailed results (individual pore measurements including pore area, diameter, and other parameters, in xlsx format), and
  • either all the original collected images or stitched photomontages (as appropriate, in .tif and/or .jpg format).

sandextractpia_summary2

Pore Size Distribution Chart
Example output data from a macroporous sandstone.
An example pore size distribution curve (derived from measurement of ~45000 individual pores from 100 BSEM images)
An example pore size distribution curve (derived from measurement of ~45000 individual pores from 100 BSEM images) in a sample of micritic limestone.

Petrographical Descriptions

We offer sample descriptions at a range of level of detail, from summary descriptions focussed on a specific set of feature(s) in a sample or sample set, up to completely-comprehensive characterisation of all aspects of the sample.

SEM Image showing clays on a grain surface, associated with quartz overgrowths and pyrite euhedra.

Most of the descriptive work is carried out using optical (plane-polarised light) light microscopy.  However, additional detail will usually be added using scanning electron microscopy and other microscopy methods as required.   Any additional micrcoscopy observations are incorporated directly into the sample descriptions (and not presented as separate descriptions).

There is always a temptation to “scrimp-and-save” a little on this aspect of petrographical studies, but this is the time where the real detail and intricacies of samples can be investigated and documented.

Continue reading Petrographical Descriptions

Scanning Electron Microscope (SEM) Petrography

tile04 Scanning Electron Microscopy (SEM) can be carried out as a stand-alone service, or in support of other petrographical analyses / descriptions.  We can analyse a range of sample types including small rock chips (“stub” samples) and polished thin-sections, as well as other materials.

Our main uses for SEM imaging and analysis are:

  • Detailed characterisation of clay mineralogy and other microcrystalline components (and their associated microporosity)
  • Elucidation of paragenetic relationships
  • Investigation of zoning and chemical variability within cements.
  • Systematic / automated collection of images for pore image analysis
  • Preparation of petrographical montages for deep zoom imaging

Because we have Scanning Electron Microscope capabilities in-house, we can offer a rapid turnaround / hotshot analysis of samples.  (Many geological materials can be analysed with a minimum of preparation – the samples only need to be dry and, in the case of samples containing liquid hydrocarbons, light cleaning is also required ).

Continue reading Scanning Electron Microscope (SEM) Petrography

SEM images of arrow construction

arrow1When I’m not being a geology nerd and using our excellent microscopy facilities for work, I’m also a keen amateur archer.  Most of the time I’m probably better at petrography than I am at archery.  However, now and again I have a good day and can shoot arrows into something resembling a good group.  On a really good day I “Robin Hood” myself and shoot an arrow into the back of another one already in the target.

Continue reading SEM images of arrow construction

Shoulders of others

80When we bought our bench-top SEM a few months ago, I thought it would be interesting to revisit this sample, which is one that I spent a lot of time looking at when I was a PhD student (  …  back in the day … sigh). I also read a piece in today’s paper that gave me pause to think about just how much I   (try not to)    take for granted in my day-to-day work .

Continue reading Shoulders of others