Tag Archives: Services

SEM Pore Image Analysis

Icon Illustrating A Sandstone Pore System

Traditionally pore throat size distribution data is measured using mercury intrusion porosimetry (or MICP).  However, this is not always possible /appropriate, so we can also offer pore size distribution data generated from analysis of scanning electron microscope (SEM) images.  This methodology is applicable to any lithology (and is well-suited to very fine-grained sediments such as micritic limesonte / chalk).  Data can also be collected from fragments of a specific lithology within cuttings samples, extending the “reach” of capillery-pressure type measurements into uncored intervals.

SEM images are collected systematically over an area of, or of random fields within, a polished thin-section.  Following segmentation of the images into pores and “grains” (everything else), detailed information on pore volumes and pore sizes is collected.

These results can be used alongside other measures of pore volume and pore size when modelling permeabilities (e.g. helium porosities, mercury intrusion data, and nuclear magnetic resonance data).

Imaging

The strategy for image collection is dependant upon the nature of the sample and its pore system.  The SEM magnification is set according to the range in pore size we are attempting to characterise.  Depending upon the samples, we may collect images from random, non-contiguous fields over the sample area, or regularly distributed, overlapping fields (that can also be stitched into deep zoom photomontages).
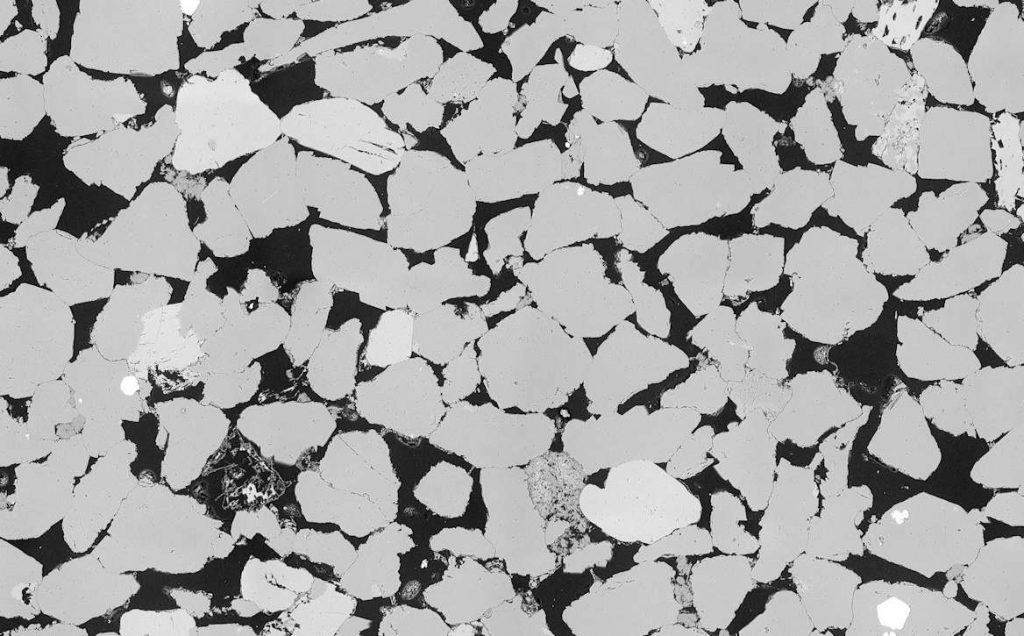
Backscatttered SEM image showing a porous sandstone.
Extract from a larger photomontage stitched from 240 individual images. Grains / mineral matter appear in various shades of grey.  Pores appear black / very dark grey. (Field of view of this extract ~1875um; the source montage is~19000*12000 pixels and covers a real world area of ~10.0*6.0mm, with a resolution of 1pixel ~0.5*0.5um).

Segmentation

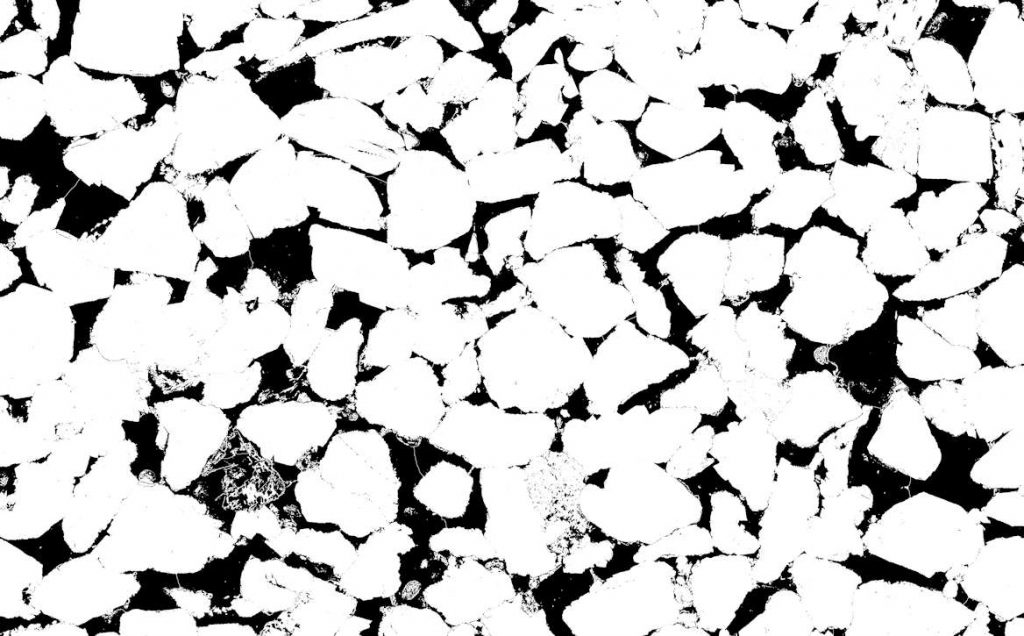
Thresholded image showing pores (black) and grains (white).
Extract from a larger photomontage stitched from 240 individual images. Grains / mineral matter appears in various grey shades. Pores appear black / very dark grey. (Field of view of this extract ~1875um; the source montage is~19000*12000 pixels and covers a real world area of ~10.0*6.0mm, with a resolution of 1pixel ~0.5*0.5um).

Image analysis routines are used to normalise images to consistent grey-scales and to remove any shading effects.   Pores are then segmented from grains and, where required, more advanced routines are used to separate / subdivide touching / connected macropores from one another.

Measurement

Pore sizes and areas are measured and the results processed to provide total pore areas and pore size distribution data.
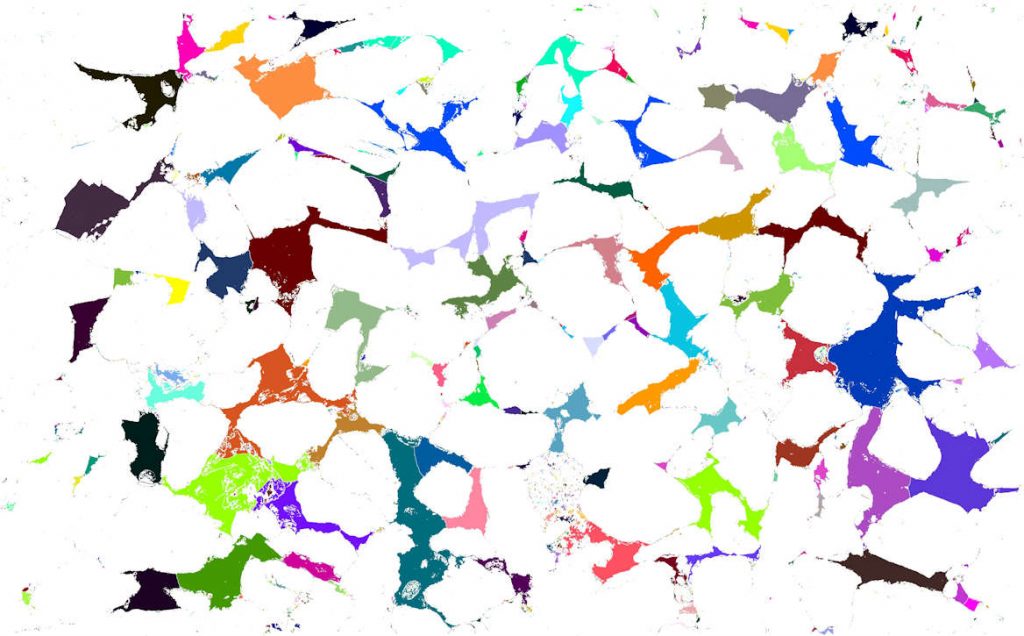
Image analysis output showing segmented and separated pores.
Same field of view as shown above showing measured pores [separate pores shown in different colours] and grains [white]. (Field of view of this extract ~1875um.)

Output Data

Results provided include:

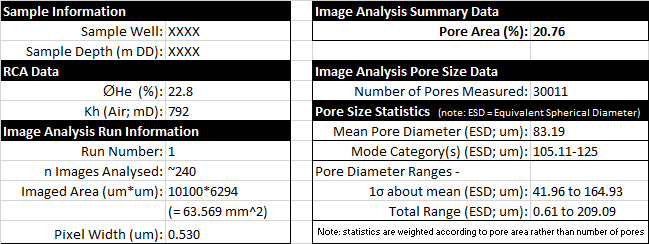
  • Summary data (pdf format; including summary and plot shown as below),
  • Detailed results (individual pore measurements including pore area, diameter, and other parameters, in xlsx format), and
  • either all the original collected images or stitched photomontages (as appropriate, in .tif and/or .jpg format).
sandextractpia_summary2

Pore Size Distribution Chart
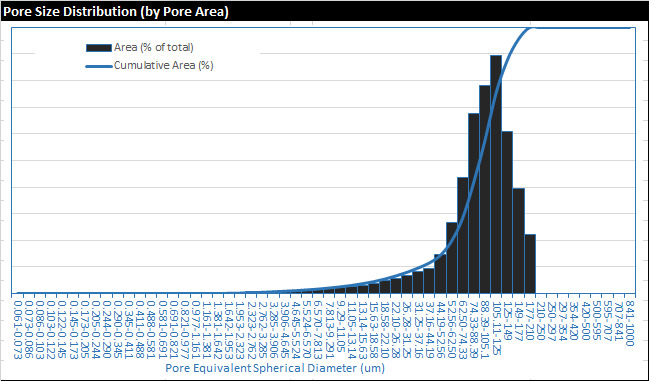
Example output data from a macroporous sandstone.
An example pore size distribution curve (derived from measurement of ~45000 individual pores from 100 BSEM images)
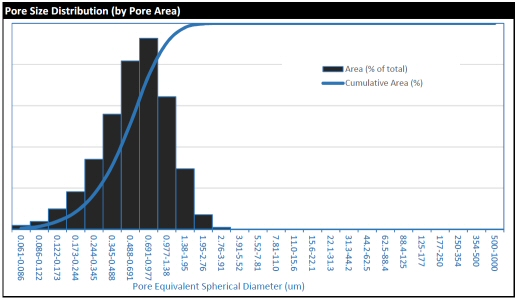
An example pore size distribution curve (derived from measurement of ~45000 individual pores from 100 BSEM images) in a sample of micritic limestone.

Epifluorescence

We use epifluorescence predominantly to investigate the character and distribution of hydrocarbons trapped within fluid inclusions. Our system is equipped with a Zeiss HBO UV illuminator and “Epiplan Neofluar” objectives covering a wide range of magnifications (x1.25 up to x100).  Using the digital camera attached to this microscope we are able to capture images of specific inclusions under the very low light levels that are commonly encountered during epifluorescence imaging.

Epifluorescence image of hydrocarbon in fluid inclusions
Image captured using mixed transmitted (plane polarised) light and incident UV (epifluorescence) illumination, showing a cluster of fluid inclusions trapped within vein calcite. Within this cluster, the inclusions trap different proportions of an aqueous fluid (non-fluorescent, so appears colourless in this image) and a brightly blue fluorescent hydrocarbon liquid. Where the inclusions only trapped the aqueous liquid, they have remained monophase at room temperature (i.e. have failed to nucleate a vapour bubble). In contrast, in the inclusions that trap a mixture of water and hydrocarbon, vapour bubbles are prominent within the hydrocarbon phase. (Field of view ~180um.)

The colour of the fluorescence is a reflection of the composition of the hydrocarbon, and can be used in a qualitative sense to approximate oil API gravity.  Where samples have seen multiple generations of hydrocarbon of differing compositons / maturities, epifluorescence can be used to differentiate between different generations of fluids.  This, combined with microthermometric analysis of the fluid inclusions, can be used to reconstruct filling / fluid histories.

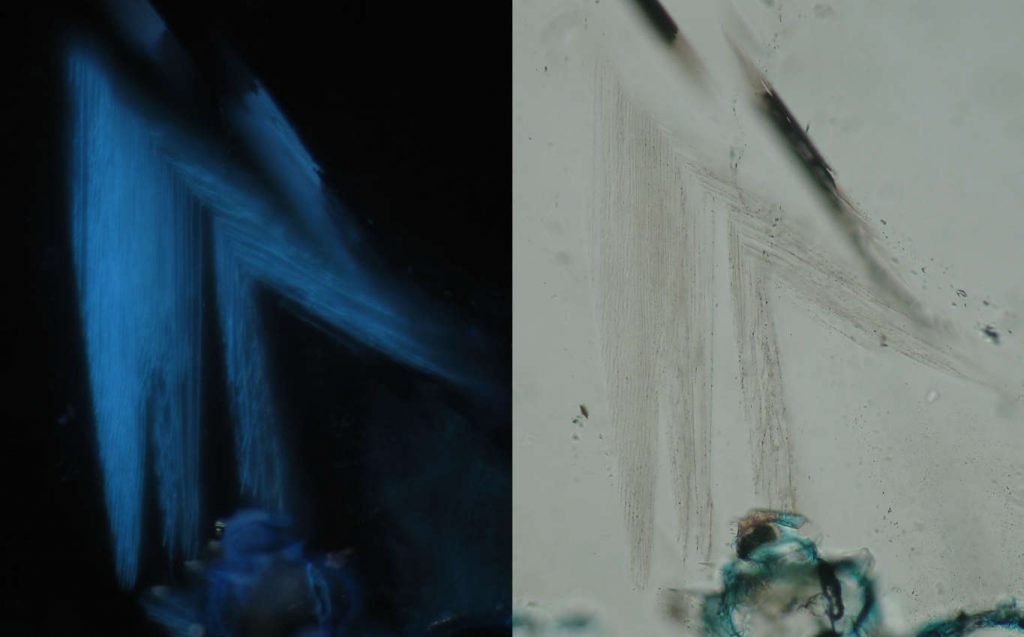
Paired Epifluorescence and plane polarised light images of minute inclusions trapped along growth zones in quartz.
Paired epifluorescence and plane polarised light images showing planes of very fine, blue-fluorescent hydrocarbon inclusions trapped along growth planes in authigenic quartz (field of view of each image ~430um).


Textural Analysis

What is it and why might you need it ? 

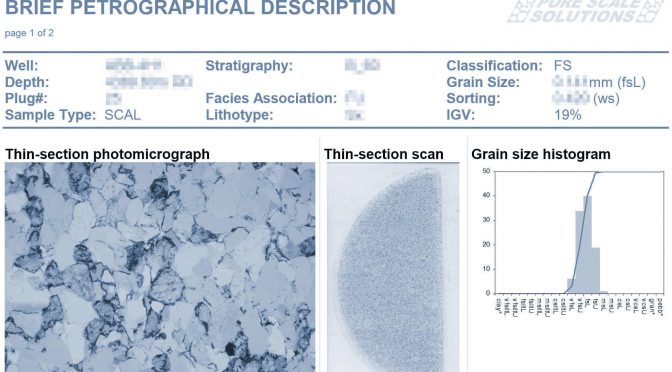
Textural Analysis provides basic data on sandstone grain size, which almost invariably exerts some degree of control on final reservoir quality (either directly, or indirectly depending upon the degree of diagenetic overprinting).   The grain size data is also useful for calibration of core grain size in heavily cemented sediments, where original grain size is not always easy to determine in core, and cannot be measured accurately using bulk approaches (e.g. seive analysis or laser particle sizing).

We provide the raw data, as well as summary statistics including averages, sorting and other measures of spread and skew – including systematic grain size classification (in ½Φ bins).

Continue reading Textural Analysis

Legacy Data Evaluation

Dumped with a load of data, collected from numerous wells over a long time period, by different analysts, that appear to be inconsistent?

Icon symbolising Digitisation

For mature fields, there is often a wealth of legacy petrographical and reservoir quality information that is lost within volume after volume of single well characterisation studies and interim reports.  This data may, or may not, have been previously integrated and properly incorporated into reservoir models.

There are a number of strands to taking this data and bringing it back to life:

  • the logistics of mining the data from paper or scanned documents and compiling them into digital formats for deeper interrogation.
  • understanding from a geological and petrographical perspective what the data actually mean, and assimilating it into an internally consistent database.
  • once an internally consistent database is assimilated, it can then be properly interrogated and interpreted.
  • If legacy samples (e.g. thin-sections) are still available, then these can be used to further refine the observations using more modern instrumentation.

Continue reading Legacy Data Evaluation

Fluid Inclusion Microthermometry

What are fluid inclusions and why might you want to analyse them? 

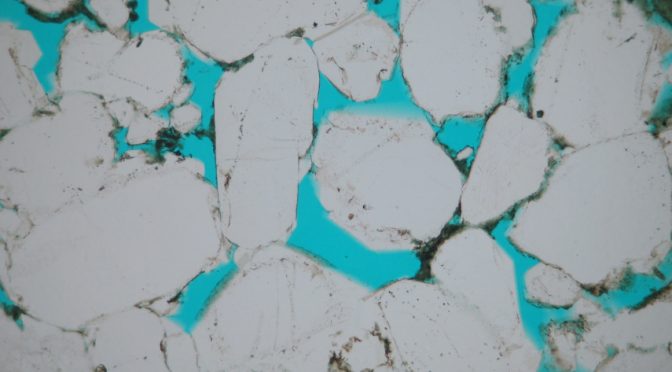
Fluid inclusions are fluid-filled vacuoles sealed within minerals.  Using a combination of microscopy techniques, and specialised equiment to measure the temperatures at which the trapped fluids undergo various phase changes, we can derive information about the temperature and pressure conditions, as well as indications of the compositions of the fluid(s) present, during mineral growth and inclusion trapping.

Optical Photomicrograph
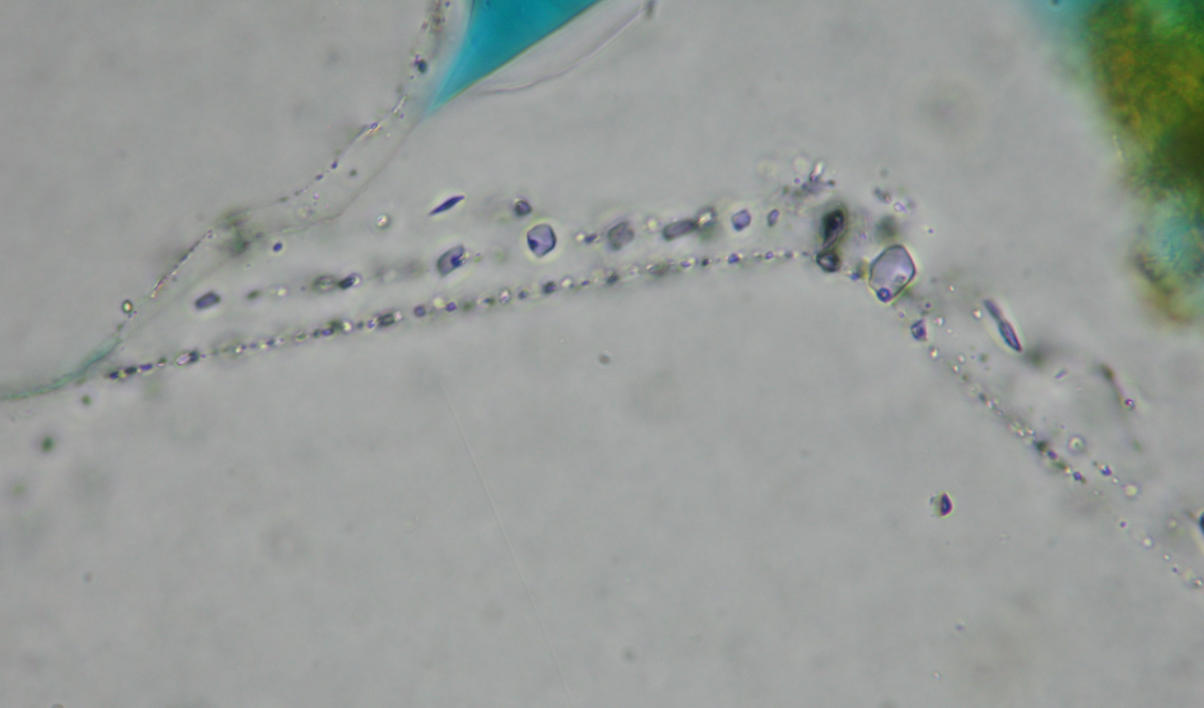
Fluid inclusions trapped at the interface between a detrital quartz grain and a quartz overgrowth (field of view 150um).
Optical Photomicrograph
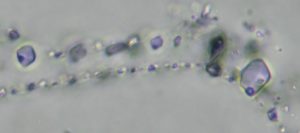
Detail of the image above, showing fluid inclusions trapped at the interface between a detrital quartz grain and a quartz overgrowth (field of view 57um).

Continue reading Fluid Inclusion Microthermometry

Petrographical Descriptions

We offer sample descriptions at a range of level of detail, from summary descriptions focussed on a specific set of feature(s) in a sample or sample set, up to completely-comprehensive characterisation of all aspects of the sample.

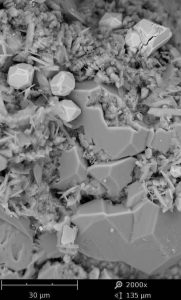
SEM Image showing clays on a grain surface, associated with quartz overgrowths and pyrite euhedra.

Most of the descriptive work is carried out using optical (plane-polarised light) light microscopy.  However, additional detail will usually be added using scanning electron microscopy and other microscopy methods as required.   Any additional micrcoscopy observations are incorporated directly into the sample descriptions (and not presented as separate descriptions).

There is always a temptation to “scrimp-and-save” a little on this aspect of petrographical studies, but this is the time where the real detail and intricacies of samples can be investigated and documented.

Continue reading Petrographical Descriptions

Modal Analysis

What is it and why would you need it ? 

Modal analysis (point counting) data provides fundamental information on the composition of your samples, including:

  • Original detrital mineralogy.
  • Authigenic mineralogy.
  • Nature and abundances of macropores.

Data / results are presented in spreadsheet format, integrated onto individual sample descriptions and used extensively throughout our reports on various plots and diagrams.   The phases differentiated during modal analysis are tailored on a project-by-project basis – and can be designed to be consistent with existing datasets for mature fields, or compliant with the inputs required for “Touchstone” modelling.

Continue reading Modal Analysis

Scanning Electron Microscope (SEM) Petrography

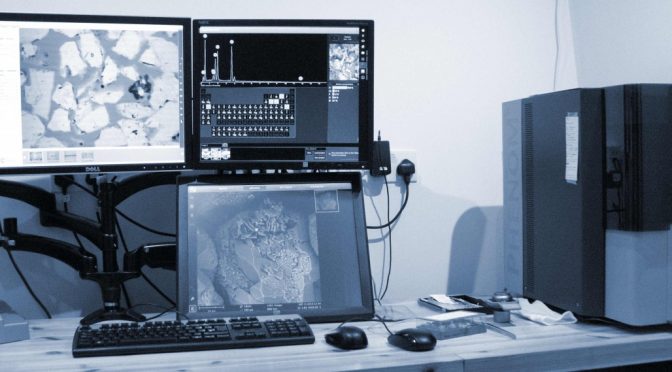
tile04 Scanning Electron Microscopy (SEM) can be carried out as a stand-alone service, or in support of other petrographical analyses / descriptions.  We can analyse a range of sample types including small rock chips (“stub” samples) and polished thin-sections, as well as other materials.

Our main uses for SEM imaging and analysis are:

  • Detailed characterisation of clay mineralogy and other microcrystalline components (and their associated microporosity)
  • Elucidation of paragenetic relationships
  • Investigation of zoning and chemical variability within cements.
  • Systematic / automated collection of images for pore image analysis
  • Preparation of petrographical montages for deep zoom imaging

Because we have Scanning Electron Microscope capabilities in-house, we can offer a rapid turnaround / hotshot analysis of samples.  (Many geological materials can be analysed with a minimum of preparation – the samples only need to be dry and, in the case of samples containing liquid hydrocarbons, light cleaning is also required ).

Continue reading Scanning Electron Microscope (SEM) Petrography